
Understanding User Behavior and Experiences listening to Audio entertainment
“Profound audio-related insights about real-time user behaviours, emotions and needs are obtained by conducting user diaries, beneficial to identify problems and uncover new opportunities in terms of User Experience field.”

Background
Scenario
Company X provides a music streaming service to its customers. We are college students and worked as a group of seven, we were hired by the client to help them understand people’s current behaviour, emotions, and experiences listening to audio entertainment (e.g., music, podcasts, radio, audiobooks, etc.) so that they can identify gaps and/or improve the experience.
Research Question
What are the pains and gains of people’s audio listening experience?
Overview of the process
Our research objective was to explore central themes regarding people’s audio listening experience. The study was divided into main four stages.
1. Planning and Preparation
Refine research question
In this stage, our team brainstormed until we reached a research question we were satisfied with. Finally, we were all curious about the positive and negative experiences of the user’s audio consumption. At this point, our research question was “What are the pains and gains of people’s audio listening experience?”
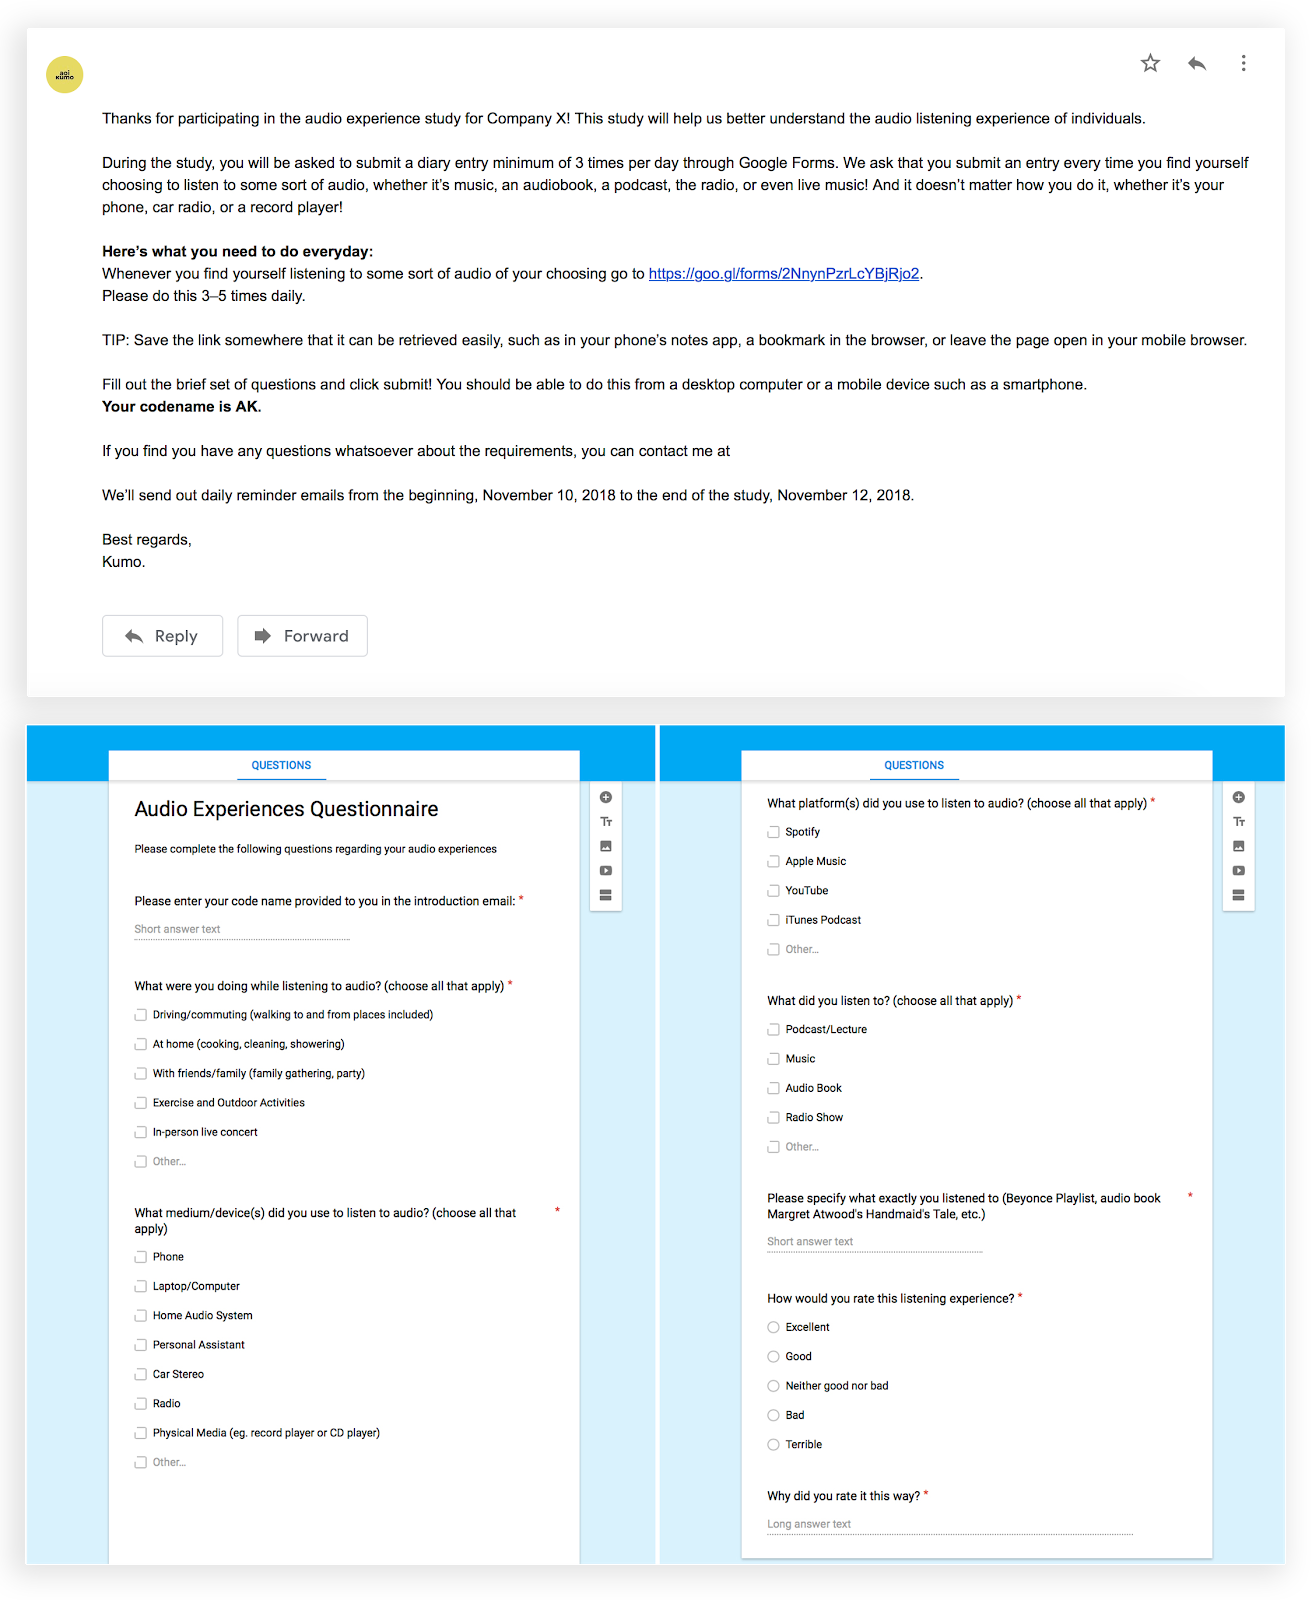
Create a Diary survey for participants
To address the research question and not create an onerous burden on participants we settled on 5 multiple choice questions and 2 open-ended questions per diary entry. The participants were then asked to complete a diary entry every time a they chose to listen to audio for the primary purpose of listening to music.
Roles and Responsibilities
Each group member was assigned to one participant to monitor and communicate with.
Facilitation
Set up Google survey form, instructions and questions for participants. A reminder was sent the day before the survey was to start and a reminder daily with the link to the survey and instructions.
Pilot
We ran a small pilot and from that, we learned that for efficiency the participants' consent should be changed to a statement rather than a question. We also learned that the questionnaire needed to include a question to identify the participant. From the pilot feedback, we made our final version of the questionnaire.
2. Running the Study
Although my participant had some problems while uploading his data, this stage has been a great run for me. I kept close track of data as surveys were submitted daily. I helped my participant at times to upload their data.
Tasks during the study run:
Sent instructions to the participant
Tracked data coming in
Contacted participants when needed
Supported participants with their issues
3. Data Analysis
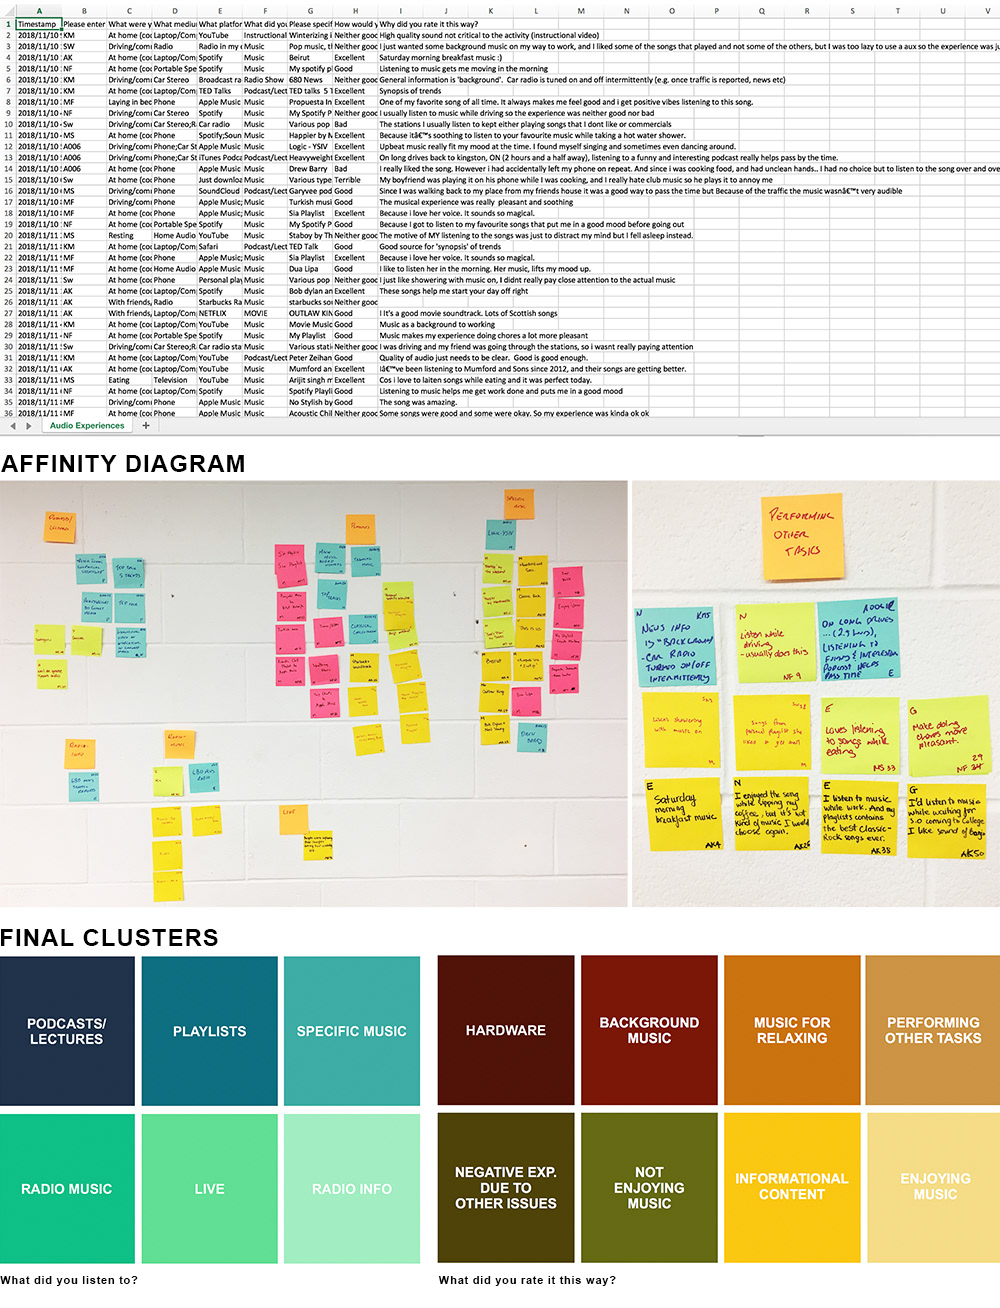
After collecting all of the data at the end of the survey we initially reviewed the data on Google Forms. We then exported the data in the Excel format. The data was then coded and we started mapping an Affinity Diagram.
Eventually, top headings of our clusters were visualized in a digital format to share within the group. We were then able to collect data points within those clusters and find themes.
4. Key themes
Negative experiences are often due to extrinsic issues, e.g. technical, content and environmental noise.
Participants who had bad or terrible listening experiences, often expressed that there was some aspect of the audio listening experience they could not control. One participant spoke about the inability to change a song that was playing on repeat because his hands were dirty while cooking. Another participant complained about a weak wifi connection causing interruptions while listening to music.
“My Internet connection was weak. So, the music would stop and start loading a couple of times and I wasn’t able to listen to the music in a seamless way!”
People listen to audio while doing other things.
51% of participants’ audio listening experiences were while they were at home cooking, cleaning, or showering and 24% were while they were driving or commuting. The data demonstrates that people most often listen to audio while simultaneously performing other tasks.
“Music makes my experience doing chores a lot more pleasant.”
Participants chose their phone over a laptop while listening to music.
The study showed that 44% of participants’ listening experiences were through a phone and 21% were through a laptop.
Listeners are cognizant of sound quality and its impact on the listening experience. Some listening experiences were bad due to poor sound quality, while other listening experiences were positive due to good sound quality.
“The experience was great. The voice was clear and audible and the experience was seamless.
Mood affects listening choice and vice/versa.
Participants’ choice of music was sometimes motivated by a desire to shift their mood. Also, they expressed a change in mood based on music they really enjoyed.
“I like to listen [Dua Lipa] in the morning. Her music, lifts my mood up.”
“Upbeat music really fit my mood at the time. I found myself singing and sometimes even dancing around."
Preferred platform for listening to music are streaming services (Apple Music and Spotify were the dominant choices).
32% participants music listening experiences were through Apple Music and 25% through Spotify.